
グーグルのAI ブラックボックス問題の解決策
AI開発はだんだん楽になってきていますので、ぜひ皆さんもやって欲しいです!今日のブログの元は:
https://cloud.google.com/blog/products/ai-machine-learning/google-cloud-ai-explanations-to-increase-fairness-responsibility-and-trust
AIと機械学習システムを開発してる技術者たちは、必ずと言っても良いほど悪名高いAI「ブラックボックス」の問題に関わる事になります。 これは予測結果を作成する機械学習システム内の隠されたアルゴリズムのことです。しかし、エンジニア自身は自分が開発したシステムが具体的に、なぜこの予測結果を出したのか分からないのです。
アルゴリズムが出した予測結果を説明することについてユーチューブや他のAIを使用している会社はこの問題に混乱していたようです。ですのでグーグルはこのチャレンジを引き受けることにしました。彼らの新サービスは「AI Explainable」と呼ばれ、ML技術者たちのための、自分らが開発したシステムをもっと理解しやすくできるシステムです。
ML開発、特にGoogleのディープラーニングシステム「TensorFlow」では、アルゴリズムをトレーニングするにはまずに多数のデータセットを取り込みます。 単純な2変数システムの場合でしたら、エンジニアはそれぞれの各データポイントから数値データを抽出する必要があります(画像の場合でしたら、ピクセルのRGB値など)。 そのあとは、グラフ上のすべてのポイントをプロットして回帰直線を計算し、まず最初にデータの傾向に最適な直線を取得します。これがAIにとって目指すべき指標になります。
そのあとは、実際のデータポイントを回帰直線ポイントと比較して、ポイントの差の数値を「エラー」と呼びます。 実際のデータポイントが回帰直線より上にある場合はプラスエラーになりますし、直線より下にある場合はマイナスエラーです。 エラーの計算をすべてのポイントを収集しますと、グラフの平均二乗誤差を得ることができます。 平均二乗誤差がゼロに近いほど、回帰直線はデータにより良く適合してると判断できます。
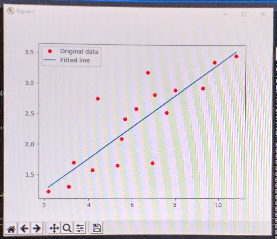
これは私が勉強でプログラミングしているAIグラフのサンプルです。
青い線が回帰直線で、赤いドットがプロットです。回帰直線から離れたプロットは「エラー」です。AIはこれを自動修復します。
モデルを最適化するために、すべてのエラーを収集してから、このエラー自体を追加のグラフにプロットされます。プロットしますと、グラフは多項式となります。 MLシステムには、このグラフの極値を計算できるようにします。 これをやるには、勾配降下オプティマイザーやアダムオプティマイザーの最適化アルゴリズムを使用します。 アルゴリズムが極値を見つけますと、この値が回帰直線の傾きになりますし、以前のグラフの新しい回帰直線となります。システムは回帰直線の平均二乗誤差の計算で精度を確認して、前述のプロセスを再開できます。
新しいデータポイントを追加されると、システムは新しい回帰直線も作成し、前述のプロセスを開始します。 MLシステムにはすべてのデータを一度に送るのではなく、データを「プール」として分けて送ります。 データの各プールは層になり、MLアルゴリズムはさまざまなデーターノードまたは「ニューロン」間と接続して計算します。通常では、トレーニング中にニューロンが「ドロップアウト」(一時的に使えなくなるように)して、ネットワークのすべてのニューロンに予測パターンを展開するように強制します。このおかげでアルゴリズムが非常に複雑になりますし、新しい層が導入されますと、エンジニアの理解を超えるほどの複雑なコードになります。
MLシステムを開発しますと、予測結果を出せるシステムはまだそれほど難しくないかもしれませんが、アルゴリズム事態を理解するのは相当難しいです。 これがMLシステムの「ブラックボックス」です。しかしビジネスとしては、MLシステムからなぜその結果が出ているのかや、どんなバイアスを取っているのかを知る必要なときもあります。
そこで、グーグルはこの問題解決手段としてまず「feature attributions」(特徴帰属)をAIの予測に統合します。特徴は、アルゴリズムが予測を開発するときに考慮に入れる変数です。 画像認識の場合では、画像の輪郭パターン、画像の輪郭、色などのことになります。予測を計算しますと、MLシステムは特徴の関連制度にスコアを付けます。このスコアは、どれの特徴を重要に考慮したかが明確になります。
「AI Explainable」は、「counterfactuals」と呼ばれる実際結果と違う予測と実際結果を比較して、なぜこの結果をださなかったのかを説明します。多数の「counterfactuals」を比較して、予測を行う際にモデルが何に注意を払っていないのかがわかるようになります。
MLモデルの分析、デバッグや、改善するための実用的な一歩ですので、MLを開発している企業や研究室の役に立つと考えられます。しかし、MLモデルのコードを完全明確にするためにはまだまだ先の話になります。 ブラックボックスを完全理解す事はAI分野のフロンティアです。MicrosoftやAmazonなどの会社が日々競争しています。
もっと詳しい説明はグーグルのホワイトペーパーをご覧になってください:
https://storage.googleapis.com/cloud-ai-whitepapers/AI%20Explainability%20Whitepaper.pdf
[English]
Google’s Solution to Demystifying the AI BlackBox Problem
For those of us that are undertaking the creation of AI and machine learning system, we run into the problem of the infamous AI “blackbox”. This is essentially the hidden algorithm inside of the machine learning system that creates the prediction results but the engineers themselves do not know how exactly they work themselves.
This was a problem that services like Youtube was facing when they could not necessarily explain how recommendation algorithm made the various decisions that it did. But Google has stepped up to the plate to take on this problem. They have developed a service called AI Explainable which will help ML engineers better understand what is going on under the hood.
ML development, such as in the case with Google’s deep learning system TensorFlow, initially takes in large number of data sets to train its algorithm. In a simple two variable system, engineers would then need to extract numeric data from each of these data points, such as rgb values for individual pixels on an image. They would then plot all the points on a graph to calculate a regression line to first get a best fit line for the trend in the data.
They will then compare the actual data point with the corresponding point in the regression line, and the difference between the points is what is called an error. When the actual data point is above the regression line it is positive error and when it is below the line, it is a negative error. Gathering all the points will get you the mean square error of your graph. The closer the mean square error is to zero, the better the regression line fits the data.
In order to optimize the model, all the errors are gathered and plotted on an additional graph, which will give you a polynomial equation. ML system will need to figure out how to find the global minimum of the graph. In order to do this, it will need to use an optimization algorithm such as gradient descent optimizer or Adam optimizer. When the algorithm finds the global minimum, this becomes the slope of the regression line and a new regression line is created and the system can check the accuracy of the with calculating the mean square error and restart the aforementioned process.
When new data points are added to the system, the system will also make a new regression line and start the aforementioned process. ML are not fed all the data at once but rather in pools of data. Each pool of data is seen as a layer and the ml algorithm will make connections between various nodes or “neurons” across the algorithm. There is also commonly a dropout of neurons during training that will force the network to develop patterns across all neurons. This will make the algorithm become exceedingly more complicated with each new layer introduced to the point that the engineer can no longer understand what the underlying code is doing to get the results that it is doing.
So essentially it is easier to get the ML system up and running and to get the end result than to understand how the resulting algorithm works. This is the “blackbox” that develops when creating an ML system and can cause problems for businesses when they need to understand what kinds of biases are appearing in the system and if they want to try to adjust those biases.
How Google tackles this problem is to integrate “feature attributions” to the AI prediction. Features are the variables that an algorithm takes into consideration when developing its predictions. In the case with image recognition, these would be the outline pattern of the image, the contours of the image, the coloration etc. When the prediction is made, these features will be attributed a score on how they were used in the prediction. This will help explain which features were used in the prediction and how strongly they were considered when making the prediction.
AI Explainable calculates these feature attributions by using things called counterfactuals, which are predictions that do not lead to the result, which are compared with the actual result. It essentially asks why the model made this prediction rather than the other. By comparing numerous coutnerfactuals, it will start to get a sense of what the model is not paying attention to when making the predictions.
This is a practical step forward for businesses and research centers to analyze, debug and improve upon their models. But to be clear, this would not provide a complete understanding of the underlying code of the ML model. Truely understanding the black box is a frontier in the field that competitors such as Microsoft and Amazon are competing against.
A more detailed explanation is provided in Google’s white paper:
https://storage.googleapis.com/cloud-ai-whitepapers/AI%20Explainability%20Whitepaper.pdf
Original Article:https://cloud.google.com/blog/products/ai-machine-learning/google-cloud-ai-explanations-to-increase-fairness-responsibility-and-trust